当サイトは、アフィリエイト広告を利用しています
prometheusを動かしてみる


サーバーリソースを監視するためにオープンソースソフトウェアの監視システムを
使ってみたので導入方法をまとめておく。
※とりあえず動かすところまで
Prometheusとは
Prometheusはサーバーリソース等を監視するための
オープンソースソフトウェア監視システム
監視対象の数が多いシステムや動的に監視対象が変化するシステムに対応できる。
Prometheusでできること
Prometheusでできることはざっくりいうと下記のようなかんじ。
- Prometheusでは監視対象サーバーから情報を取得して保管する
- 保管している情報に対して集計クエリを発行できる
- アラートも設定できる
Prometheusの仕組み
Prometheusの監視は
「監視サーバーで監視対象サーバーを監視する」
というシンプルな仕組み。
監視サーバーとは?
監視対象サーバーを監視するサーバー。
監視サーバーではprometheusをインストールして動かす
定期的に監視対象サーバーのリソース情報を収集して
prometheus内のDBに情報を保管する。
監視対象サーバーとは?
Prometheusの動いてる監視サーバーから監視されるサーバーのこと。
Prometheusの動いてる監視サーバーから監視させるために
監視対象サーバーでは「exporter」というプログラムを動かす必要がある。
exporterには監視したいリソースの種類ごとに動かす必要がある。
EXPORTERS AND INTEGRATIONS
要はPrometheusの入ってるサーバーで
exporterの入ってるサーバーを監視するということ。
Prometheusを使ってみる。
実際にPrometheusを動かしてみる。
環境
vurtualboxで仮想マシンを二つ作り、片方を「監視サーバー」、
もう片方を「監視対象サーバー」にする。
下記のような感じ
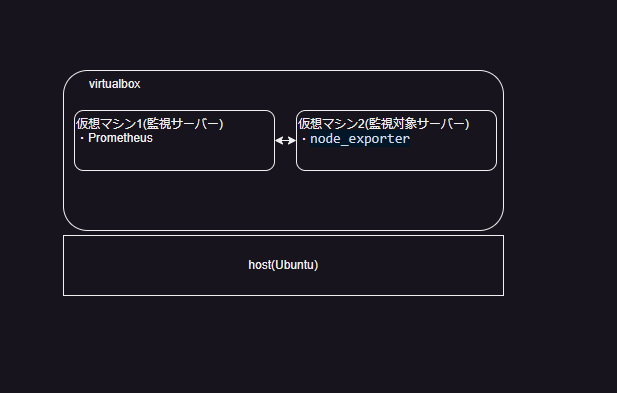
ホストマシン
ホストマシン上にvurtialboxで仮想マシンを作る。
仮想マシンにてsshで接続して操作する。
- OS:Ubuntu
- メモリ:20G
- ストレージ:512G
仮想マシン1
仮想マシン1は監視サーバー用として作成
- OS:CentOS7
- メモリ:8G
- ストレージ:50G
仮想マシン2
仮想マシン2は監視対象サーバー用として作成
- OS:rocky8
- メモリ:8G
- ストレージ:8G
Prometheusをインストールする
まずは仮想マシン1の設定からしていく
仮想マシン1は監視サーバーにするのでPrometheusをインストールする。
GitHubからPrometheusを取得する。
GitHubprometheusからPrometheusをダウンロードする。
今回はLatestのlinux-amd64を使う
$ mkdir prometheus$ cd prometheus$ wget https://github.com/prometheus/prometheus/releases/download/v2.46.0/prometheus-2.46.0.linux-amd64.tar.gz$ tar xfz prometheus-2.46.0.linux-amd64.tar.gz$ cd prometheus-2.46.0.linux-amd64/[dsh92@localhost prometheus-2.46.0.linux-amd64]$ ls -aF./ ../ LICENSE NOTICE console_libraries/ consoles/ prometheus* prometheus.yml promtool*
Prometheusを起動する
$ ./prometheus
起動してるか確認する
$ ps -auxUSER PID %CPU %MEM VSZ RSS TTY STAT START TIME COMMANDdsh92 29408 0.3 0.5 800084 43968 pts/1 Sl+ 18:09 0:00 ./prometheus
起動できているので、次に9090ポートをあける。
※開けてないとアクセスできない
$ sudo firewall-cmd --add-port=9090/tcp --permanentsuccess$ sudo firewall-cmd --reloadsuccess
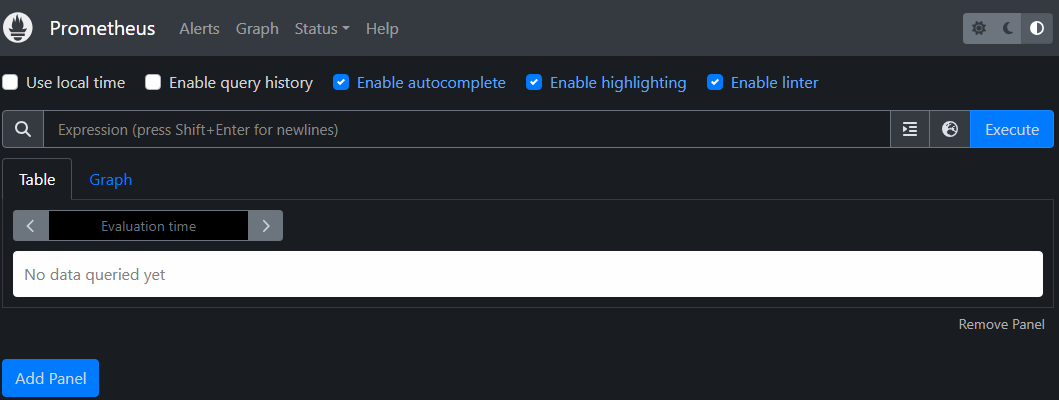
解放後にホストマシンから
http://{仮想マシン1のIPアドレス}:9090/
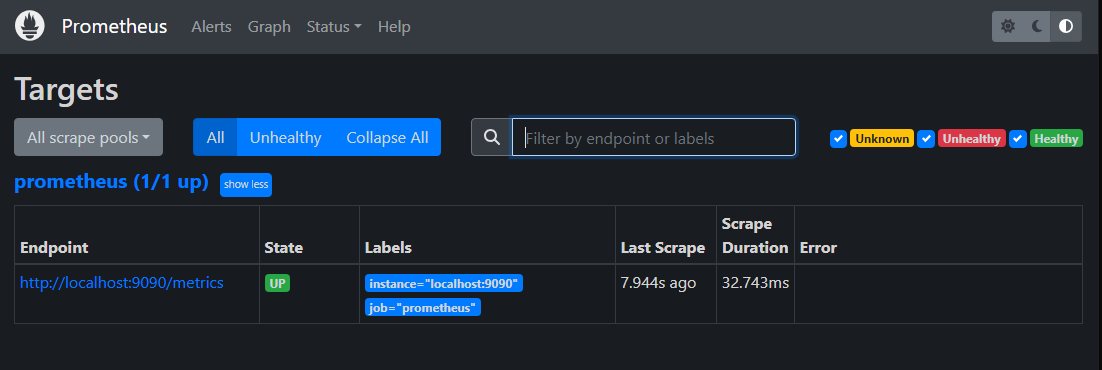
にアクセスすると下記のような画面になる。
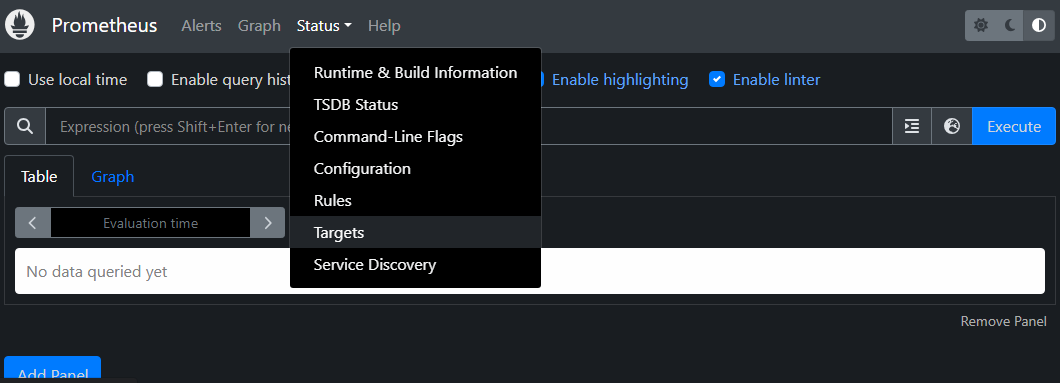
Targetを選択する
デフォルトで自サーバーを監視するようになっているため1件表示されているが問題ない。
※後で消す。
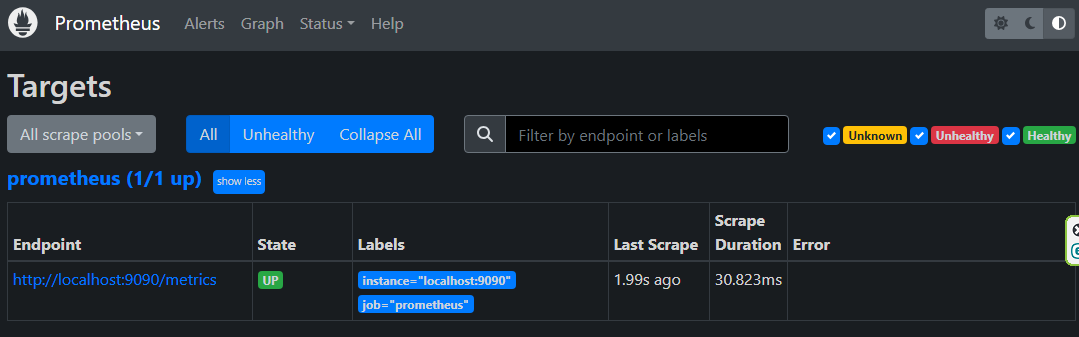
ここまでで一旦、仮想マシン1にprometheusをインストールは完了。
監視対象サーバーの設定は監視対象サーバーを作成した後に実行する。
exporterを入れる
次は仮想マシン2の設定をする
仮想マシン2にexporterを入れる。
exporterを入れることで監視対象サーバーになる。
今回はオフィシャルな exporter である Linux系OS のメトリクス情報を収集する
Node/system metrics exporter をダウンロードして起動する
$ wget https://github.com/prometheus/node_exporter/releases/download/v1.5.0/node_exporter-1.5.0.linux-amd64.tar.gz$ tar zxvf ./node_exporter-1.5.0.linux-amd64.tar.gz$ cd ./node_exporter-1.5.0.linux-amd64$ ./node_exporter --web.listen-address=:9100
起動してるか確認する
$ ps -auxUSER PID %CPU %MEM VSZ RSS TTY STAT START TIME COMMANDroot 55476 0.0 0.6 725440 23172 pts/0 Sl+ 00:22 0:00 ./node_exporter --web.listen-address=:9100
metricsを確認する。
Node Exporterが公開しているメトリクスを「http://localhost:9100/metrics」で確認できる。
$ curl -s http://localhost:9100/metrics | head$ HELP go_gc_duration_seconds A summary of the pause duration of garbage collection cycles.$ TYPE go_gc_duration_seconds summarygo_gc_duration_seconds{quantile="0"} 0go_gc_duration_seconds{quantile="0.25"} 0go_gc_duration_seconds{quantile="0.5"} 0go_gc_duration_seconds{quantile="0.75"} 0go_gc_duration_seconds{quantile="1"} 0go_gc_duration_seconds_sum 0go_gc_duration_seconds_count 0$ HELP go_goroutines Number of goroutines that currently exist.
仮想マシン1から9100ポートでアクセスするためポートを開けておく
$ sudo firewall-cmd --add-port=9100/tcp --permanentsuccess$ sudo firewall-cmd --reloadsuccess
ここまでで
- 仮想マシン1にprometheusを入れて監視サーバーにする
- 仮想マシン2にexporterを入れて監視対象サーバーにする
が完了した
この時点で先ほどの「http://{仮想マシン1のIPアドレス}:9090/」に
アクセスすると
監視対象サーバーが監視対象として認識されていないので 監視サーバー側でその設定を追加する。
prometheus.ymlを編集する
仮想マシン1のprometheus.ymlを編集して
仮想マシン2を監視対象サーバーとして
認識させる。
編集前
prometheus.ymlはデフォルトでは下記のようになっている
# my global configglobal:scrape_interval: 15s # Set the scrape interval to every 15 seconds. Default is every 1 minute.evaluation_interval: 15s # Evaluate rules every 15 seconds. The default is every 1 minute.# scrape_timeout is set to the global default (10s).# Alertmanager configurationalerting:alertmanagers:- static_configs:- targets:# - alertmanager:9093# Load rules once and periodically evaluate them according to the global 'evaluation_interval'.rule_files:# - "first_rules.yml"# - "second_rules.yml"# A scrape configuration containing exactly one endpoint to scrape:# Here it's Prometheus itself.scrape_configs:# The job name is added as a label `job=<job_name>` to any timeseries scraped from this config.- job_name: "prometheus"# metrics_path defaults to '/metrics'# scheme defaults to 'http'.static_configs:- targets: ["localhost:9090"]"prometheus.yml" 29L, 934C
編集後
下記の部分を追加する。
※仮想マシン2の設定を入れる
# my global configglobal:scrape_interval: 15s # Set the scrape interval to every 15 seconds. Default is every 1 minute.evaluation_interval: 15s # Evaluate rules every 15 seconds. The default is every 1 minute.# scrape_timeout is set to the global default (10s).# Alertmanager configurationalerting:alertmanagers:- static_configs:- targets:# - alertmanager:9093# Load rules once and periodically evaluate them according to the global 'evaluation_interval'.rule_files:# - "first_rules.yml"# - "second_rules.yml"# A scrape configuration containing exactly one endpoint to scrape:# Here it's Prometheus itself.scrape_configs:# The job name is added as a label `job=<job_name>` to any timeseries scraped from this config.- job_name: "prometheus"# metrics_path defaults to '/metrics'# scheme defaults to 'http'.static_configs:- targets: ["localhost:9090"]- job_name: "kasou2_node"# metrics_path defaults to '/metrics'# scheme defaults to 'http'.#下記を追加static_configs:- targets: [{仮想マシン2のIPアドレス}:9100"]
設定後にPrometheusを再起動する。
$ ./prometheus
設定で完了したので「http://{仮想マシン1のIPアドレス}:9090/target」にアクセスすると
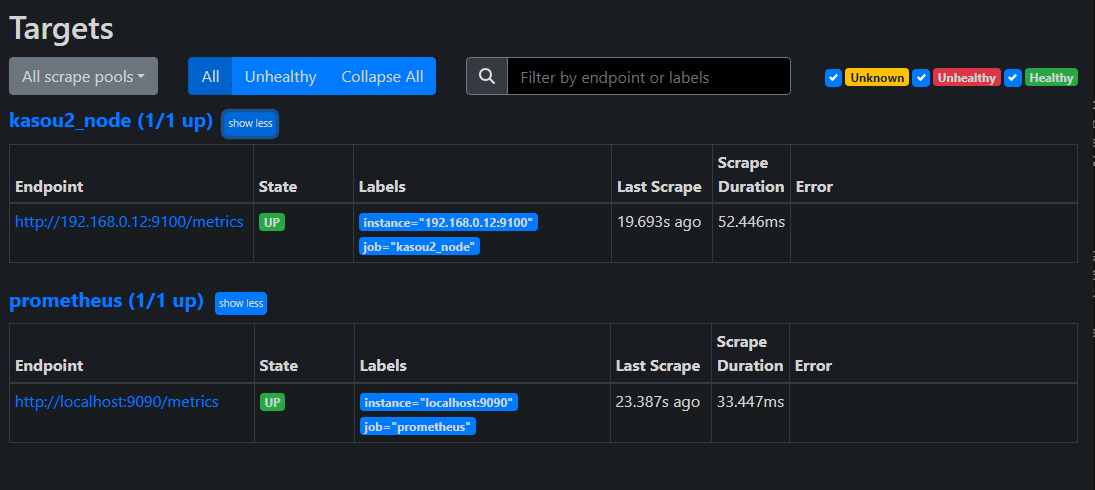
仮想マシン2が監視対象になっているの確認できる。
PromQL
PromQLはPrometheusのデータを検索できる。
ちょっと使ってみる
監視対象サーバーの一覧を表示する
「http://{仮想マシン1のIPアドレス}:9090/」の上にあるBOXにupと入力して
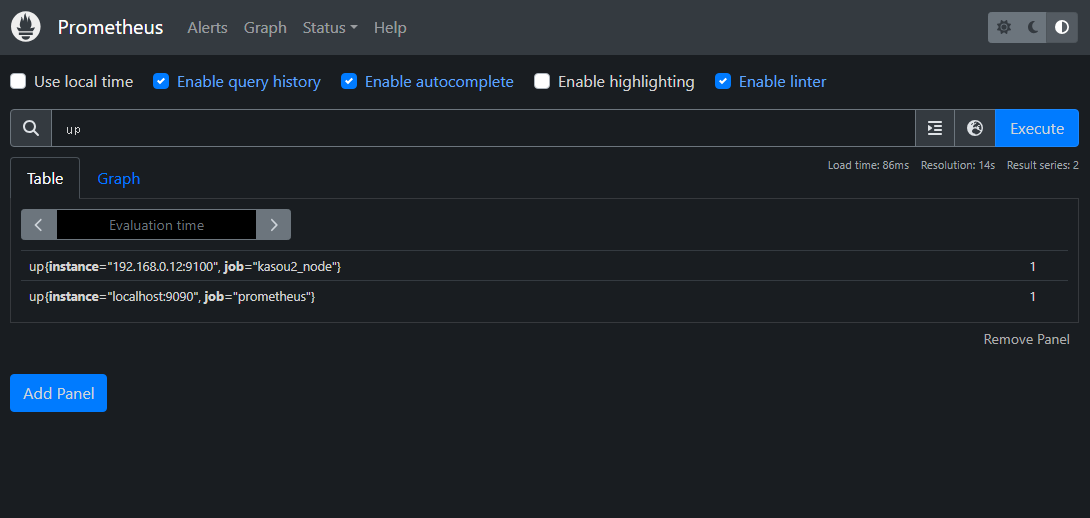
Executeを押す
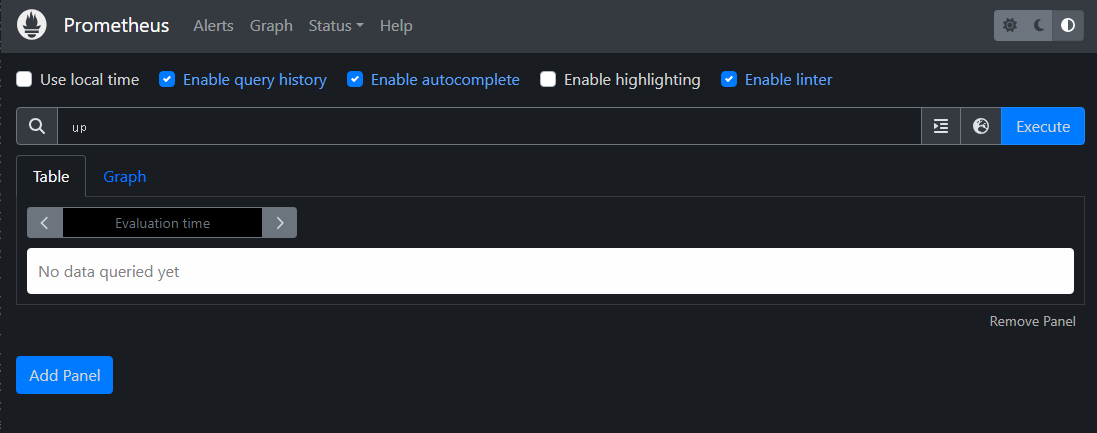
監視対象の一覧が表示される
メモリの使用量を調べる
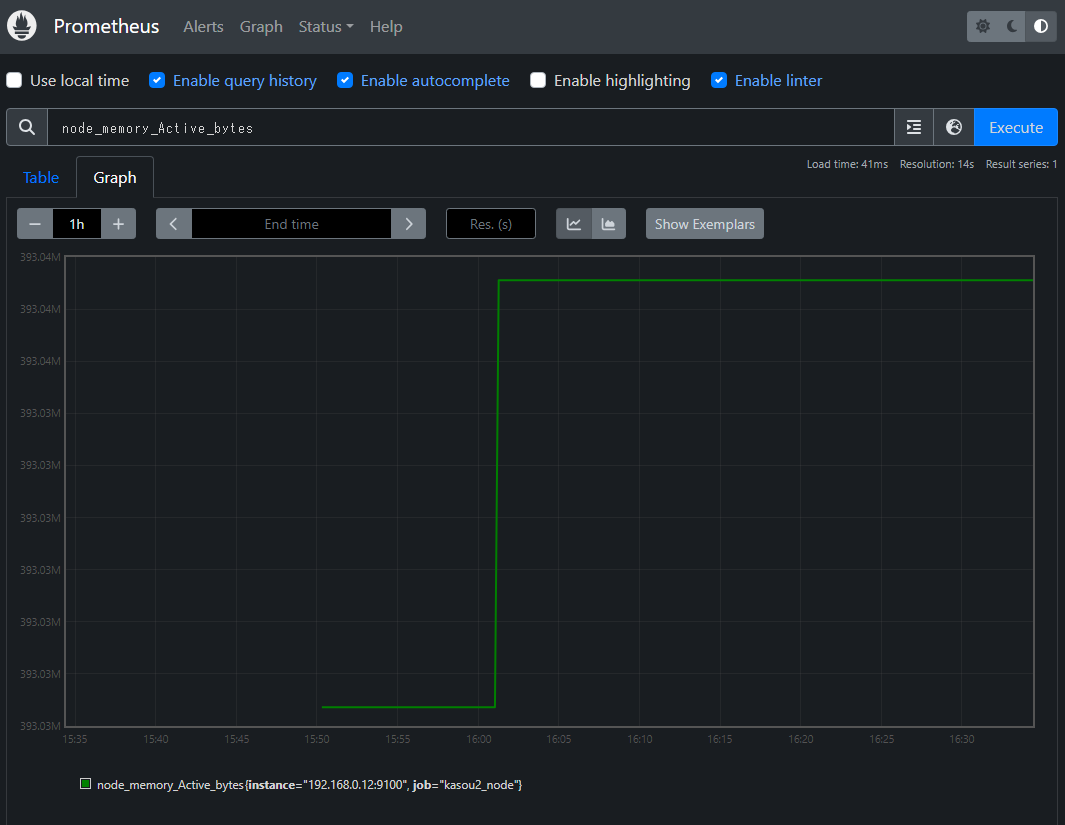
「node_memory_Active_bytes」を入力して
Executeを押すと使用量が表示される
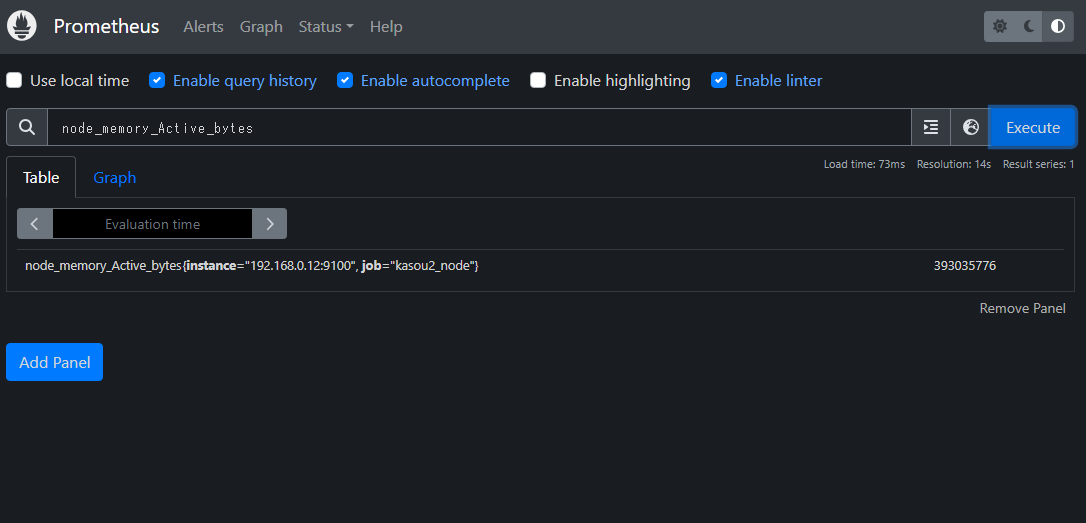
Graphタブに切り替えるとグラフで見れる
Prometheus API
Prometheus サーバー上でアクセスできるPrometheusのAPIHTTP API
監視対象サーバーの一覧を表示する
PromQLをPrometheus APIで実行してみる
$ curl http://192.168.0.11:9090/api/v1/query?query=up{"status": "success","data": {"resultType": "vector","result": [{"metric": {"__name__": "up","instance": "192.168.0.12:9100","job": "kasou2_node"},"value": [1691252773.755, "1"]},{"metric": {"__name__": "up","instance": "localhost:9090","job": "prometheus"},"value": [1691252773.755, "1"]}]}}
まとめ
とりあえずPrometheusをインストールして動作を確認するところまでは
できた。
今後もPrometheusを動かして知識が増えればまた色々とまとめていきたい。


